Week 3: DATA VISUALIZATION
- Kaley Fitzpatrick

- Sep 13, 2020
- 2 min read
DATA VISUALIZATION
Communicates information and relationships of data to a viewer through images, mapping, and graphics.
BEN FRY: Data Visualization artist
VALENCE
1999
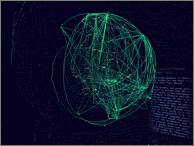
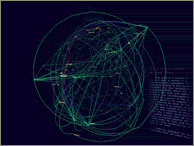
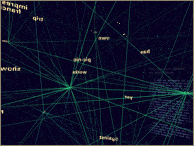
The original Valence software visualizes the word usage of a 200,000 worded book called The Innocents Abroad" by Mark Twain. Valence is suppose to be a software that explores information relationships from large groups of data/info. Fry's goal is to treat each individual piece of information as a part of an environment, in hopes of showing live relations and relationships between the different info organisms. This project was brought on because he wanted to experiment with different ways of showing very large mass of data that wasn't just a graph or regular charts. Through programming, the computer reads the book linearly while putting a node on unique words. Also the computer puts branches on words that are adjacent to one another in the book, the more they are used together, the closer they get in the model. The programming follows a set of rules he discusses in his thesis. Also words more commonly used are on the outer side of the model, while less used words are shoved towards the center. Ben talks about how despite they're being so many words in the book, there are only 15,000 unique words, which more than half are repeated. However the computer while taking in the information and reading the book, will ignore less important data, like how many 'the' are used. The Valence grows as it is being used or it is reading through the book. Additionally, Ben discusses that this information wouldn't be useful, unless presented the way it is, showing the living relationship between the words.
Video of Valence:
GENOME VALENCE:
2002

The Genome Valence is one of his newer versions of Valence. It visualizes biological data of the algorithm, BLAST, that is commonly used in Genome research.
The Valence software project that Ben Fry created is very interesting and does bring up answers and solutions to presenting large sets of data to a viewer. It is true that with smaller sets of information one can simple use a graph or chart, but when getting into more complex amounts of information and larger quantities it becomes a challenge. But with his designs and set up of programming, Ben has created a software that can display complicated large set of info into a web like sphere. However the Valence is not just a stand alone piece of information, that a viewer looks upon with one perspective. The Valence grows, moves, and feeds off of the information, like any other living organism. I greatly enjoy how he was able to give data its own living organism in order for viewers to understand and read the information provided.


Comments